

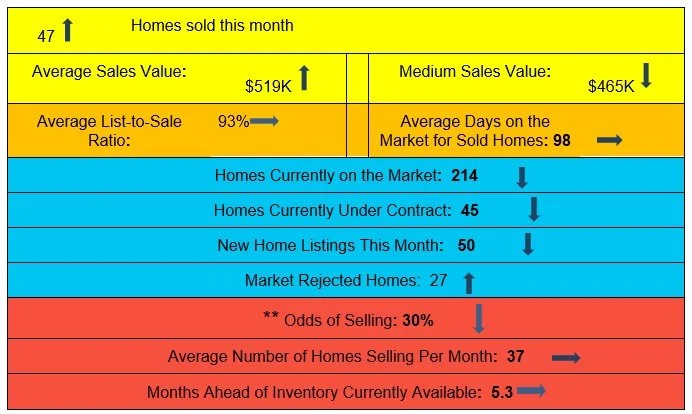
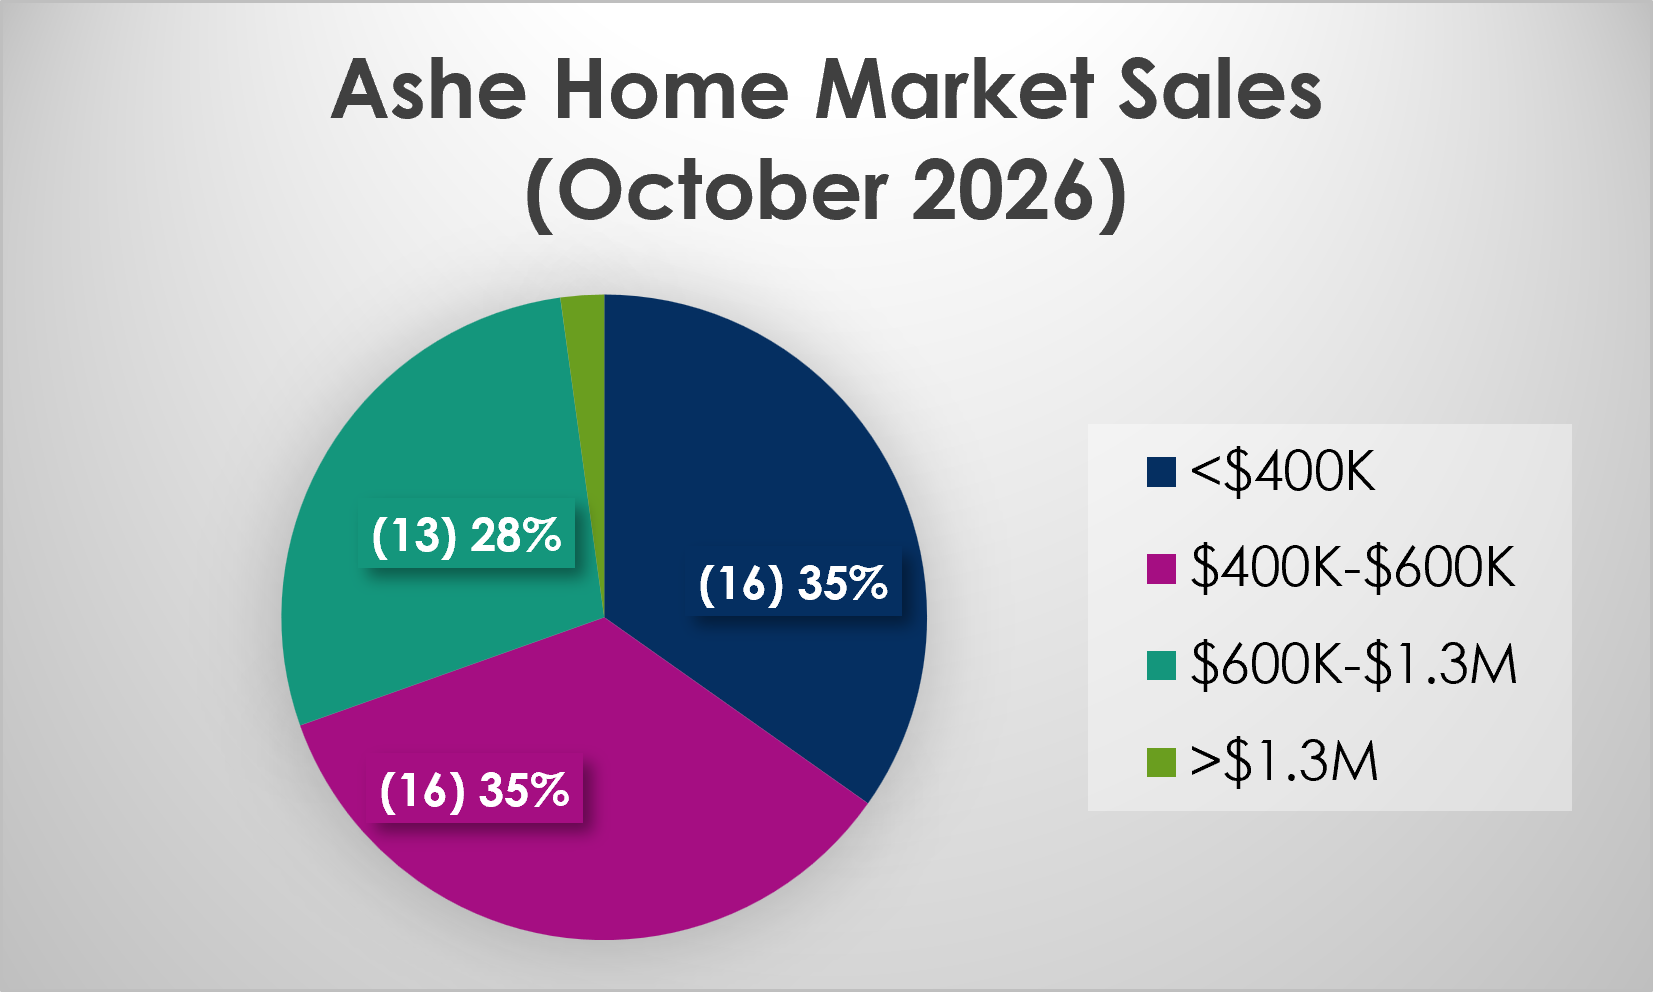
As in September, the October month shows typical signs for Fall. Activity is slowing down, not rapidly, but heading in a slowdown direction. Less properties came on the market, less sold, less are under contract than a month ago. Days on the Market were a bit shorter in October than September. More homes left the market unsold in October than September. Less homes and less land are on the market.
On the other hand, average sales prices are up. Watauga for a second month shows an average sales price over $1 mil, at $1,303,197. The average sales price in Ashe is also up, at $519,500. We’ll see how typical that is for the year, but at $1,303,197 that’s about $100,000 above the average sales price in Watauga for calendar year 2025. In Ashe county, $519,500 is about $40K above the average sales price in Ashe for calendar year 2025.
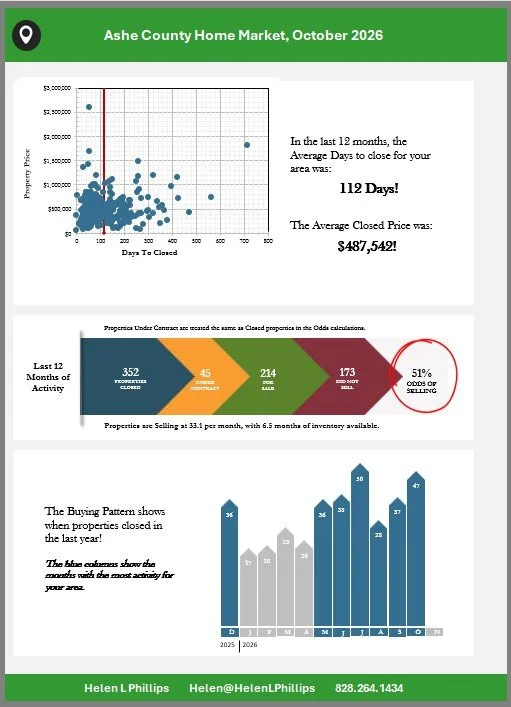

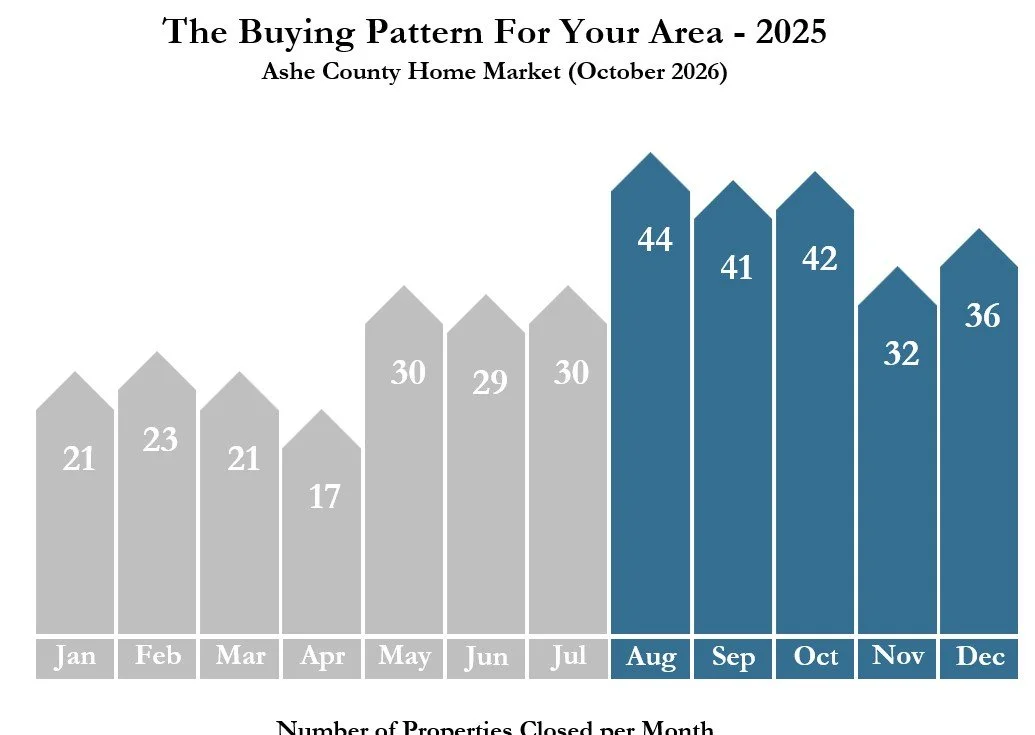
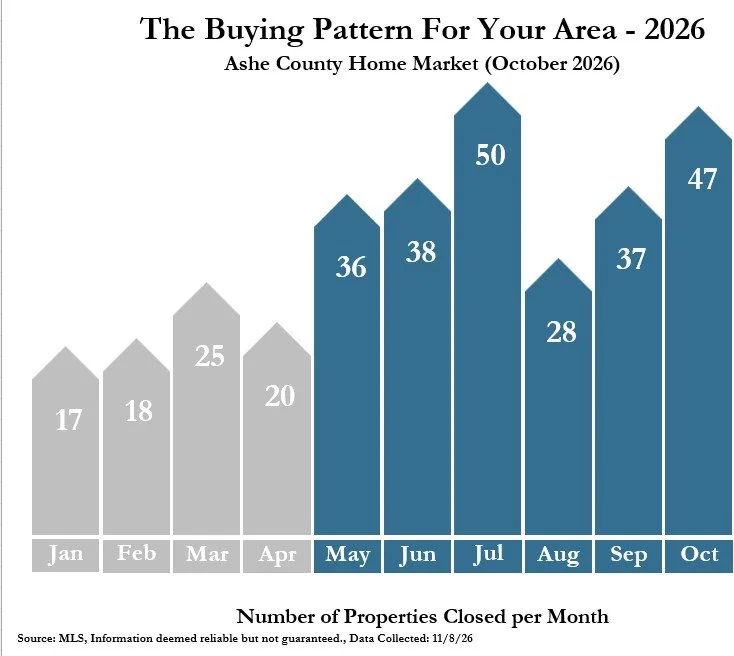
Below are the Buying Pattern graphs for 2025, followed by the current Buying Pattern graph - this allows you to compare what is happening this year to what happened last year.
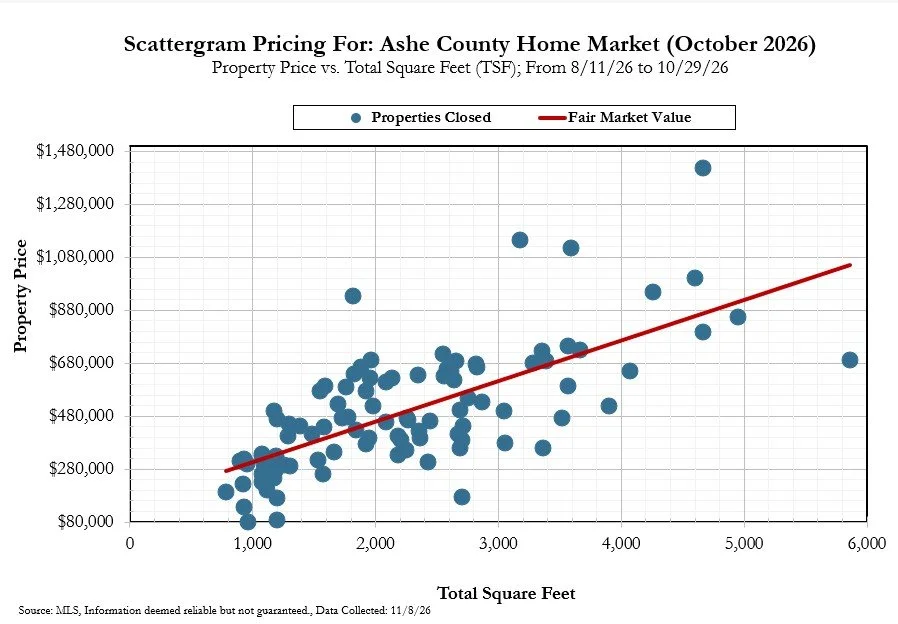
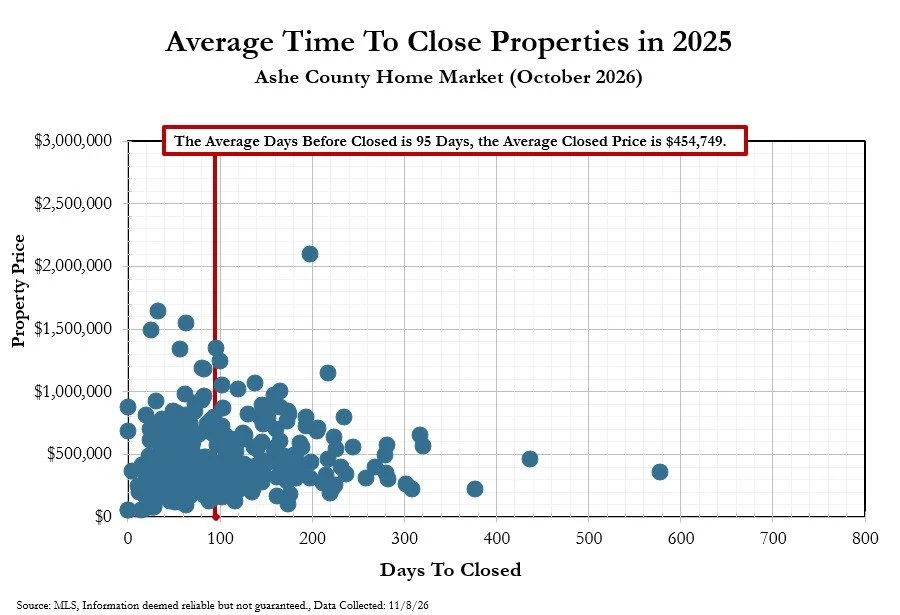
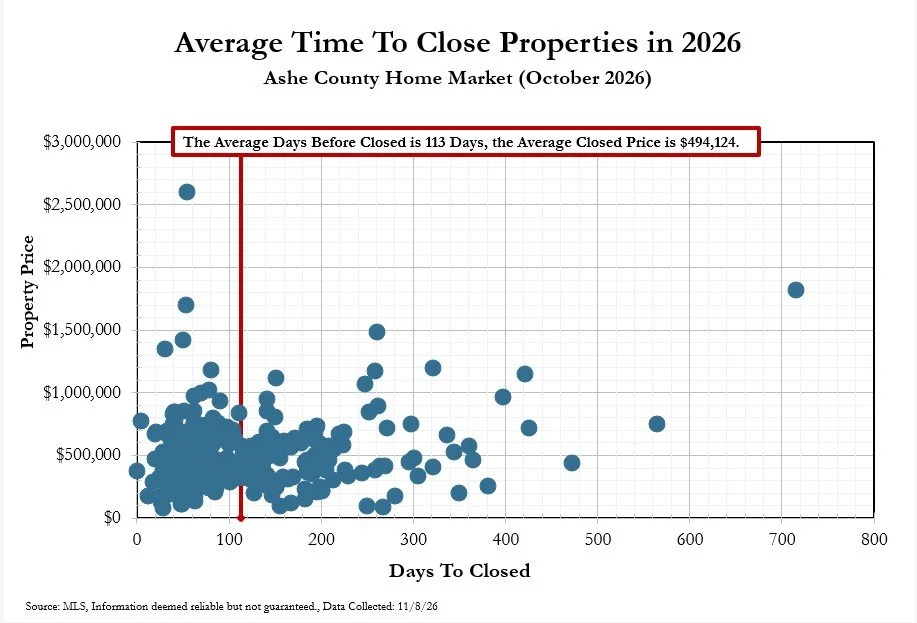
Below are the Time to Close graphs - first for 2025, followed by the current Time to Close graph. This allows you to compare how long it is taking to close properties compared to a year ago, and also compared the average closed home values a year ago to current closed home values.
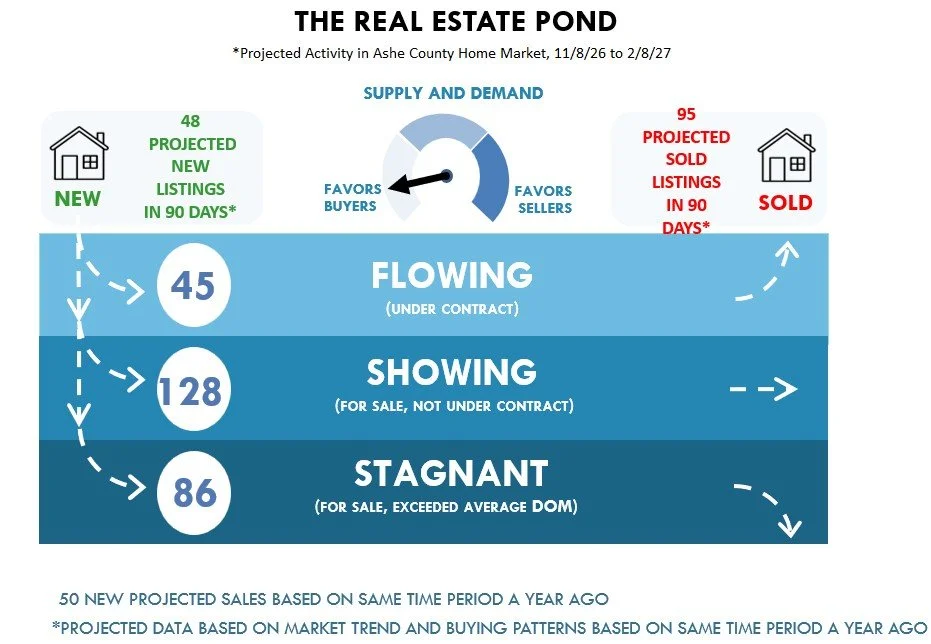
The Pond graph looks back at the rate properties sold a year ago and uses those buying patterns to project what may happen in the next 90 days of 2026.