Watauga Home Market March 2026

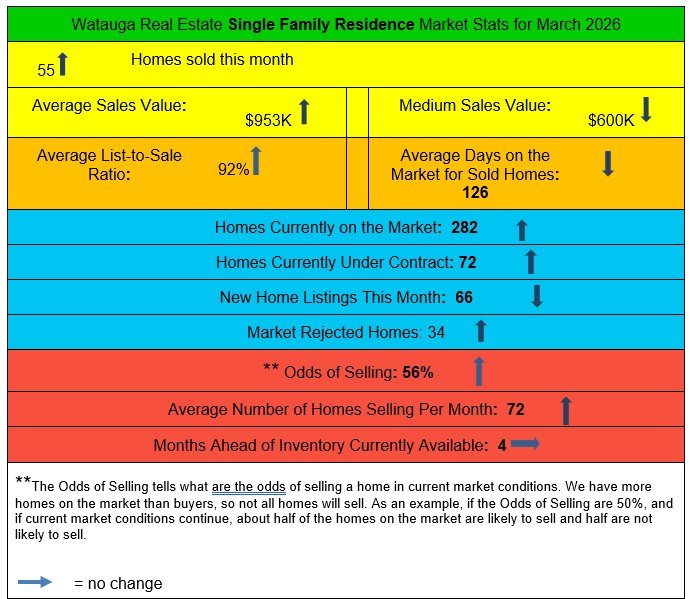
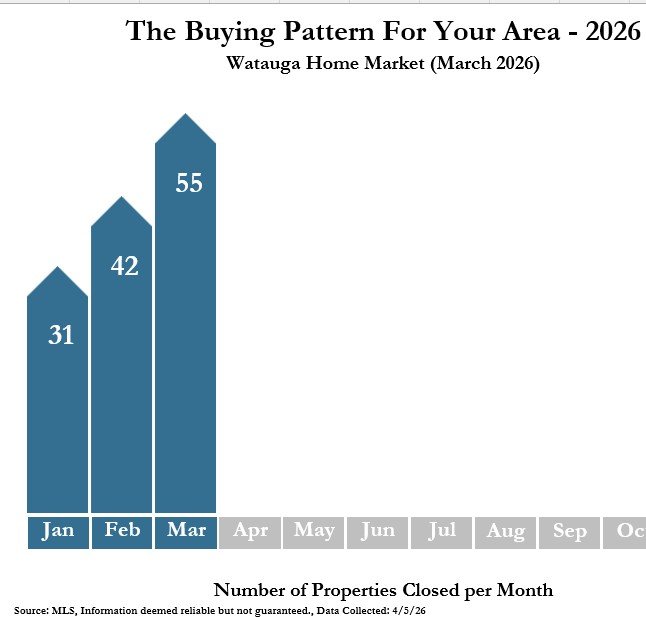
In the Watauga home market, the number sold is up a bit from the very low level of sales in January and February. The average sales value increased quite a bit, which includes a number of sales well over $1 mil. Sales are happening a tad faster, with a slightly higher list-to-sale ratio. The Odds of Selling have picked up - good news for sellers!
Multiple price reductions each day remains a constant. Of the 55 homes that sold, almost half sold after price reductions, 22 of the 55.
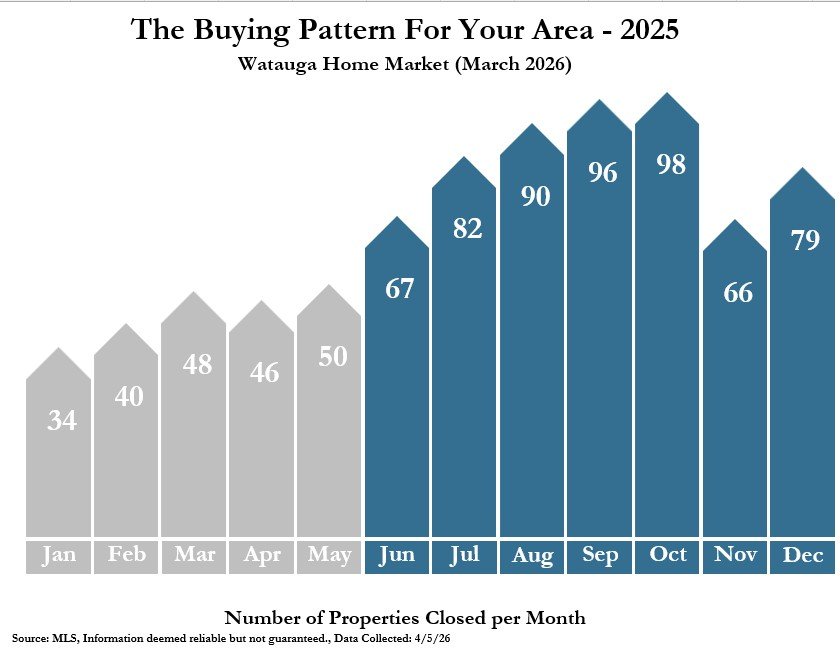
Below are the Buying Pattern graphs for 2025, followed by the current Buying Pattern graph - this allows you to compare what is happening this year to what happened last year.
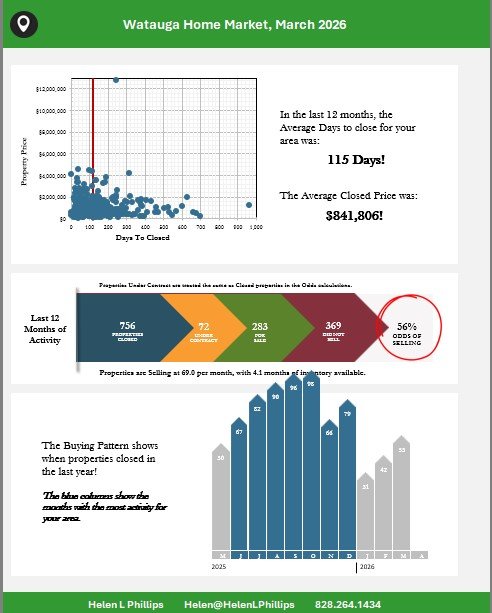
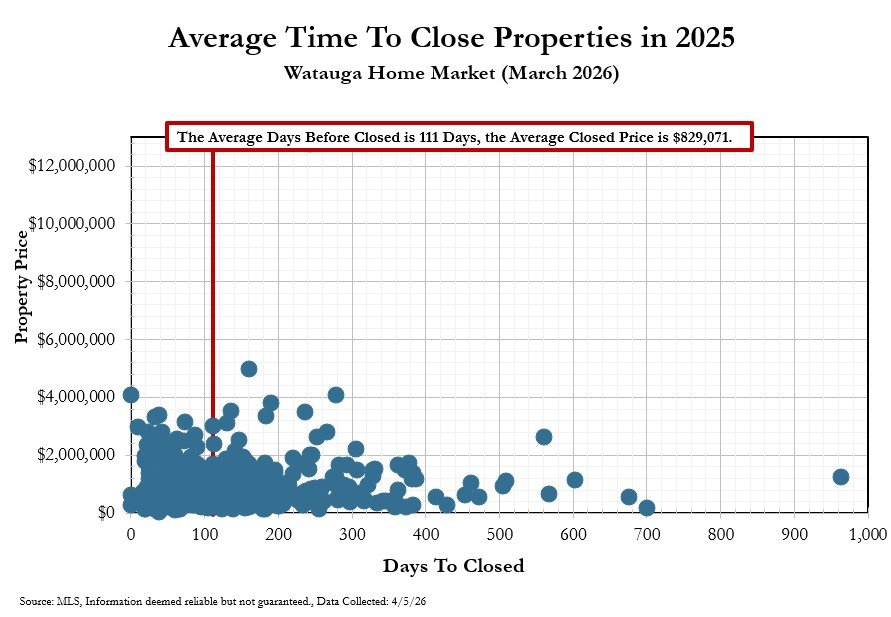
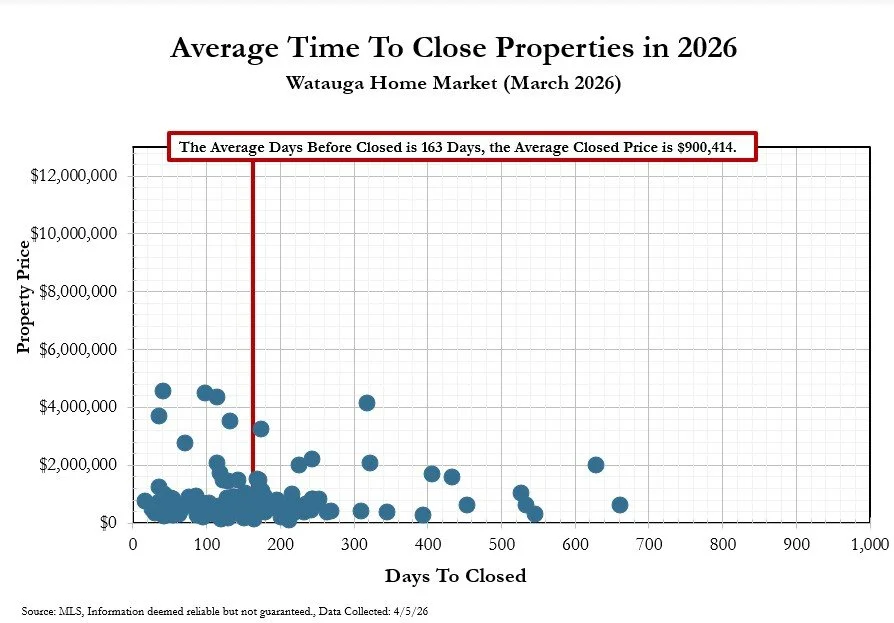
Below are the Time to Close graphs - first for 2025, followed by the current Time to Close graph. This allows you to compare how long it is taking to close properties compared to a year ago, and also compared the average closed home values a year ago to current closed home values.
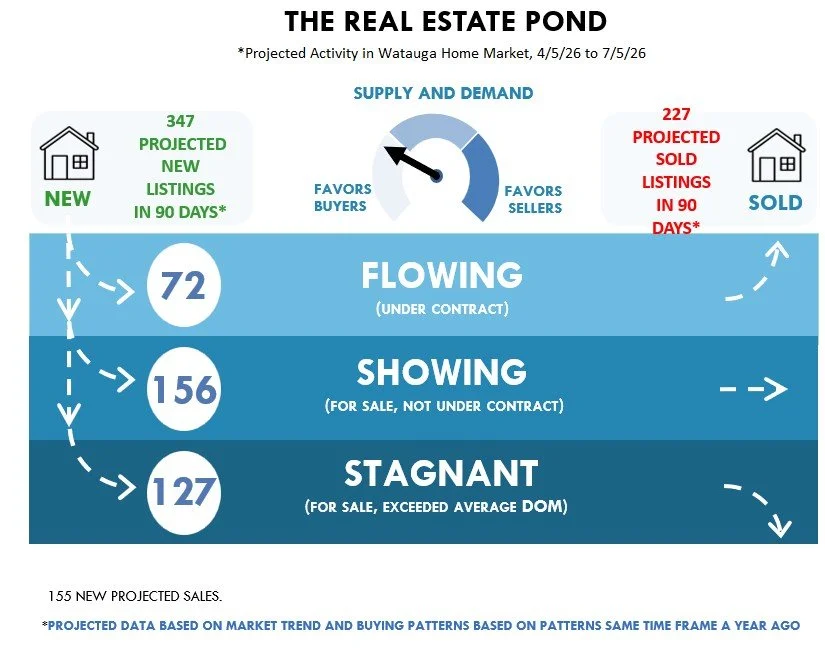
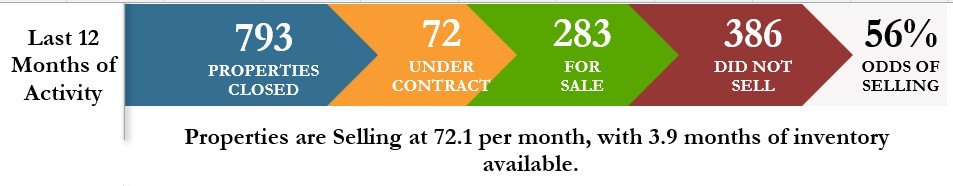
The Pond graph looks back at the rate properties sold a year ago and uses those buying patterns to project what may happen in the next 90 days of 2026.