Watauga Home Market May 2026

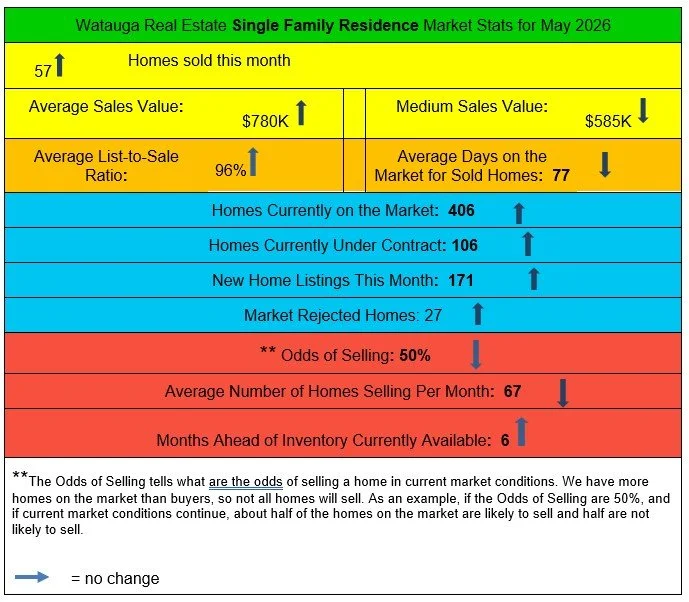
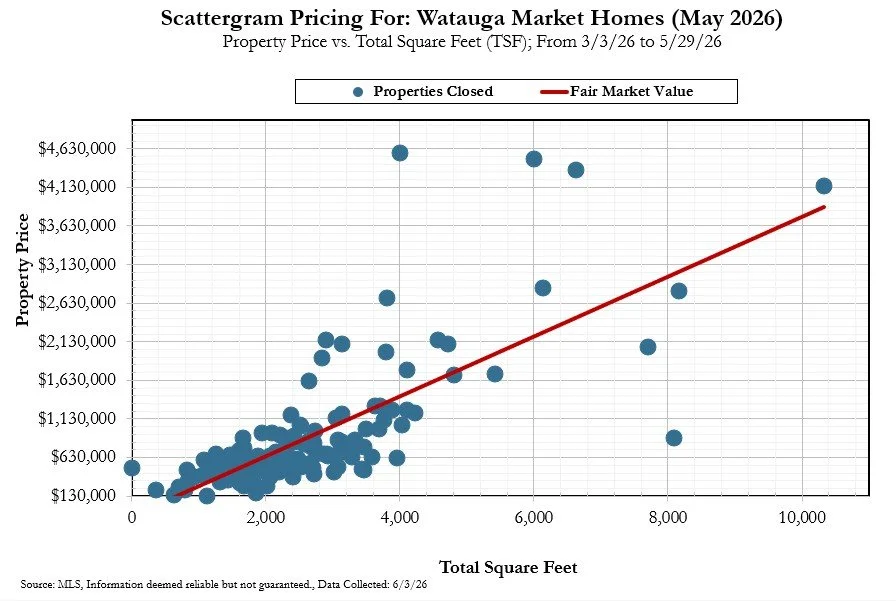
In most regards the Watauga home market is demonstrating what we would consider a typical Spring spike of listings heading into summer. The number of sales Jan-May are a bit above the numbers for that time in 2025, which were the lowest numbers for many years. It’s good to see buyer activity up a bit. In 2025 it surged during summer months. It will be interesting to see if that occurs again in 2026. The number of homes under contract in May increased 10% above the number in April, so perhaps that has begun. The number of new home listings on the market is also higher [171 in May] than April [141]. The average list-to-sale ratio increased significantly, and the number of days on the market decreased significantly, meaning homes are selling close to their list price and more quickly, another indication of increased buyer desire.
On a daily basis, each day shows numbers close to as many new homes come on the market as are reduced in price, some very quickly after coming on the market. The high number of price reductions continues to make it difficult to accurately understand current market value of homes.

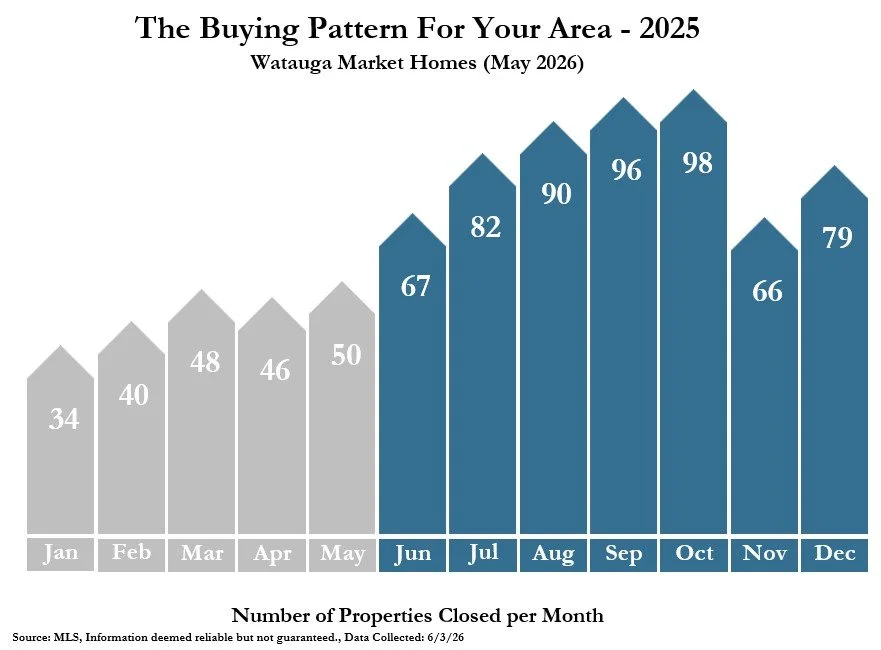
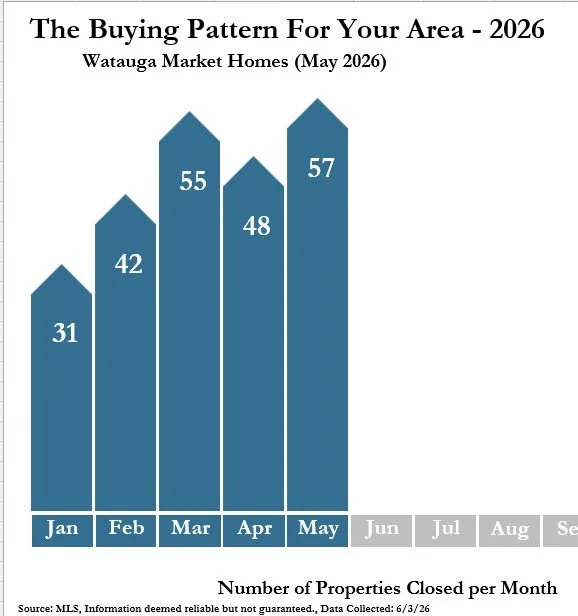
Below are the Buying Pattern graphs for 2025, followed by the current Buying Pattern graph - this allows you to compare what is happening this year to what happened last year.
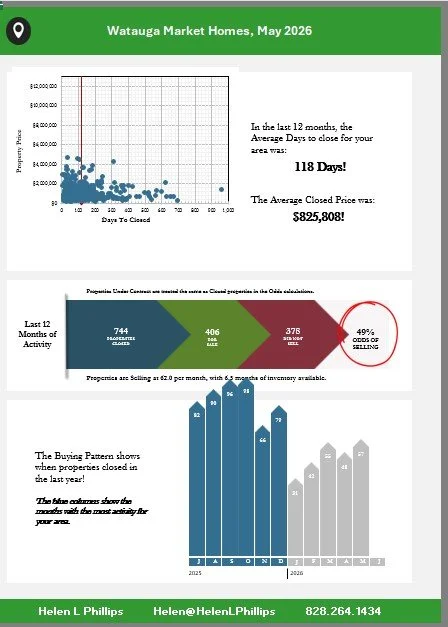
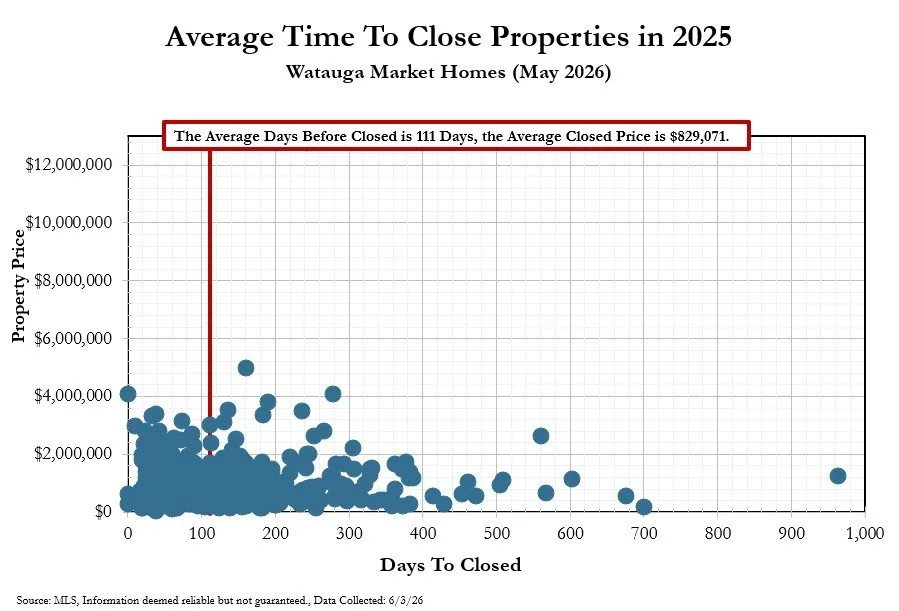
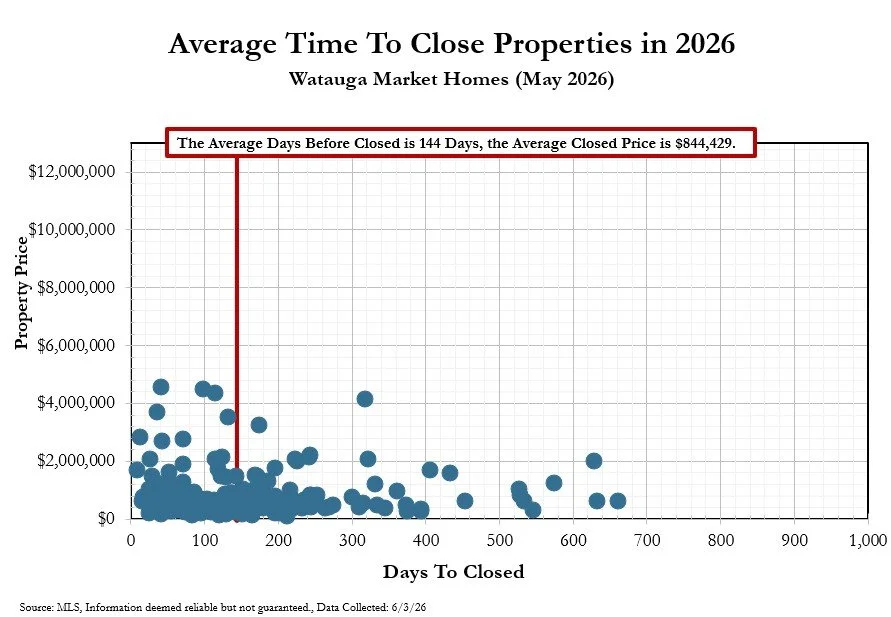
Below are the Time to Close graphs - first for 2025, followed by the current Time to Close graph. This allows you to compare how long it is taking to close properties compared to a year ago, and also compared the average closed home values a year ago to current closed home values.
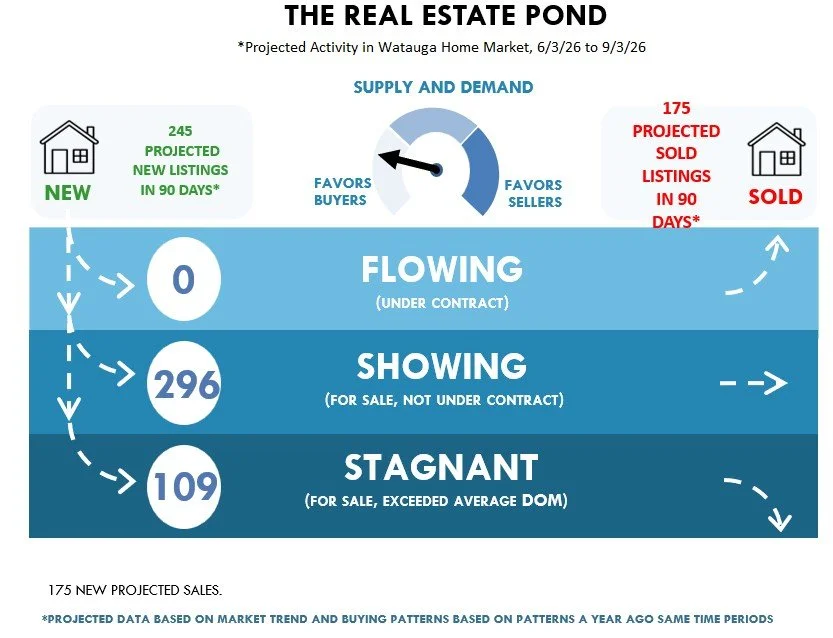
The Pond graph looks back at the rate properties sold a year ago and uses those buying patterns to project what may happen in the next 90 days of 2026.