

If you’re like myself, and everyone else I speak with, it’s hard to believe October is here. September just seemed to vanish.
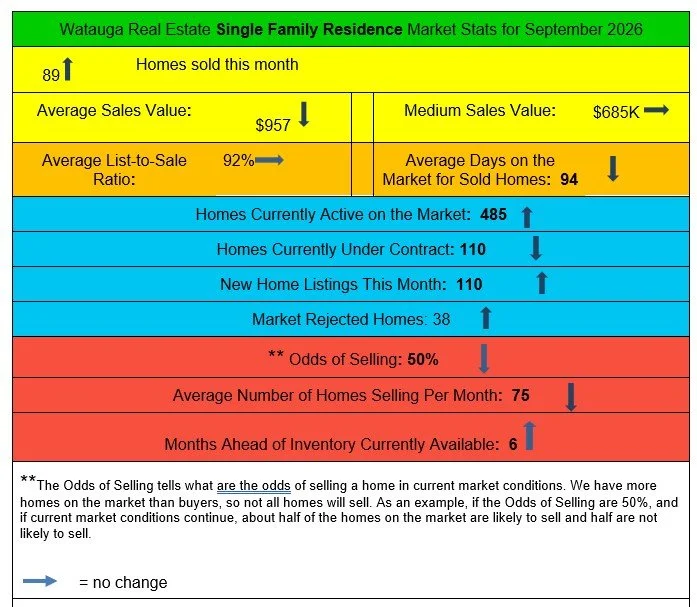
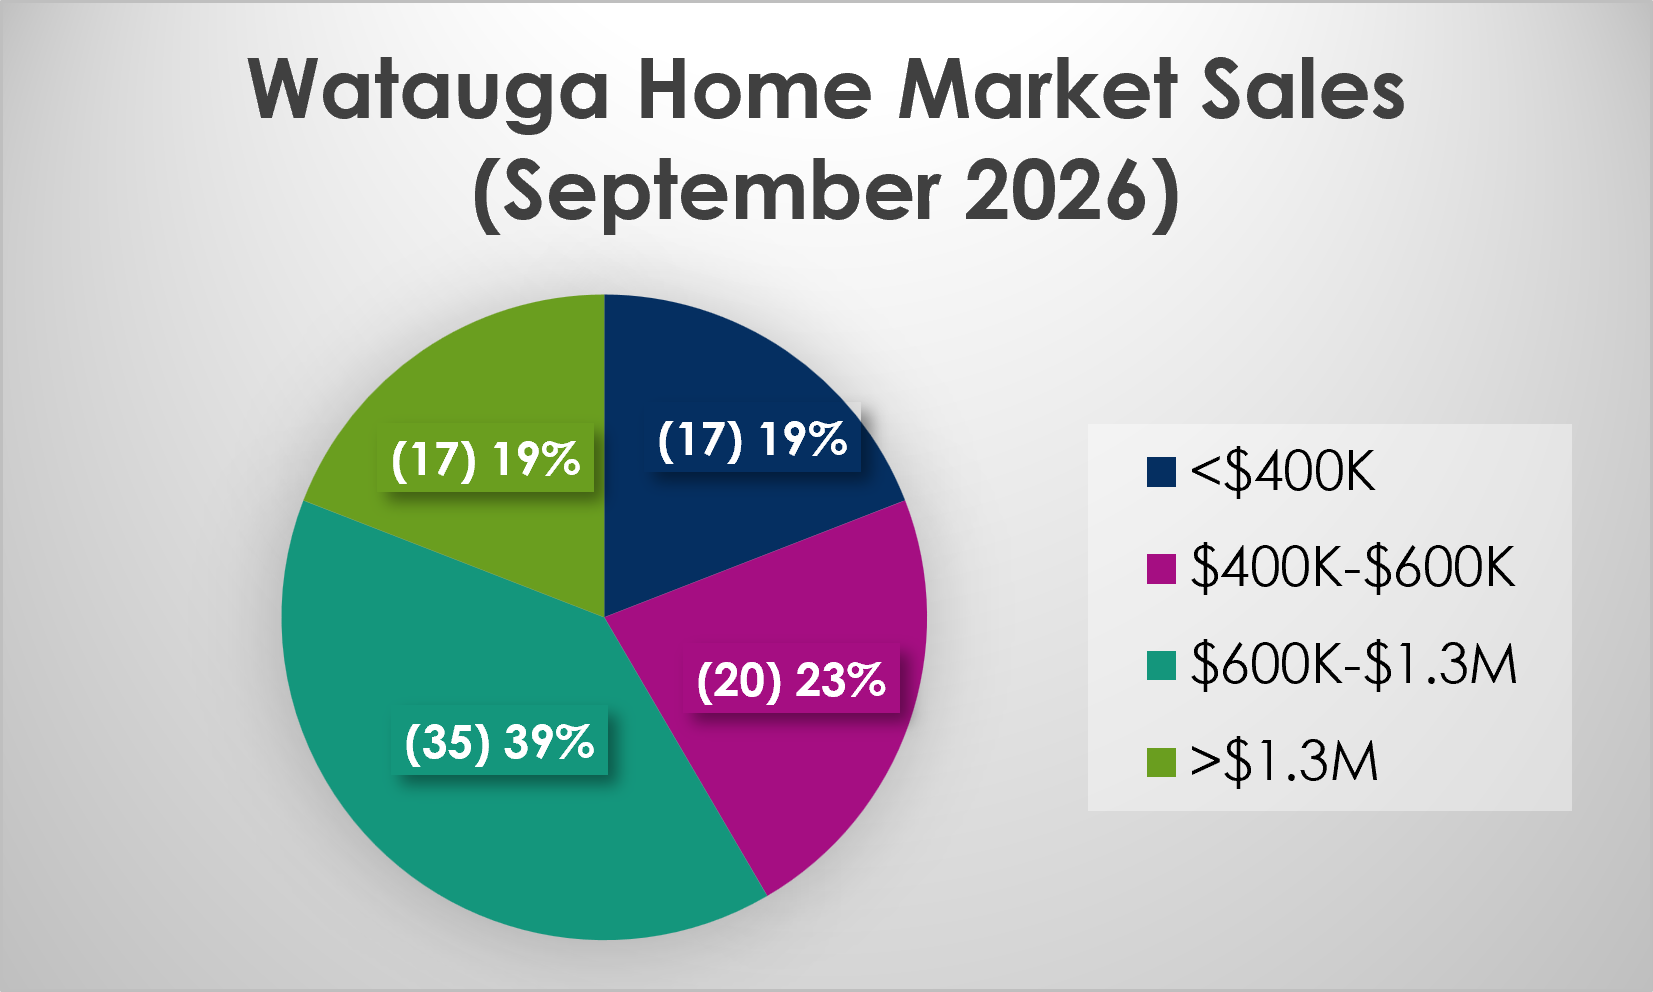
The Watauga home market acted like it typically does – the number of sales increased [still 10% behind September 2025]. Homes sold a bit quicker. The average sales value is down a touch since August; the median sales value is about the same as August. Both are above 2025 levels, certainly creating the idea that average sales values are increasing despite the continuing large number of price reductions in all value ranges. More homes are on the market than a month ago. Typically, the number of new listings coming on the market in September begins to lessen, so that is a surprise. Less homes came under contract in October than August, which is typical for the beginning of the winter months. With more homes on the market and less under contract, the Odds of Selling dropped two points. It definitely remains a buyers’ market.


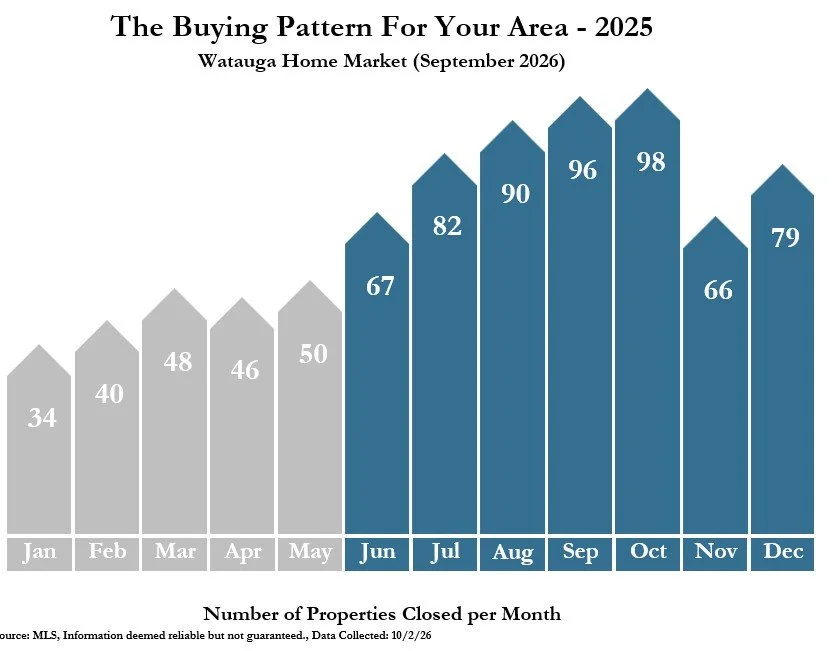
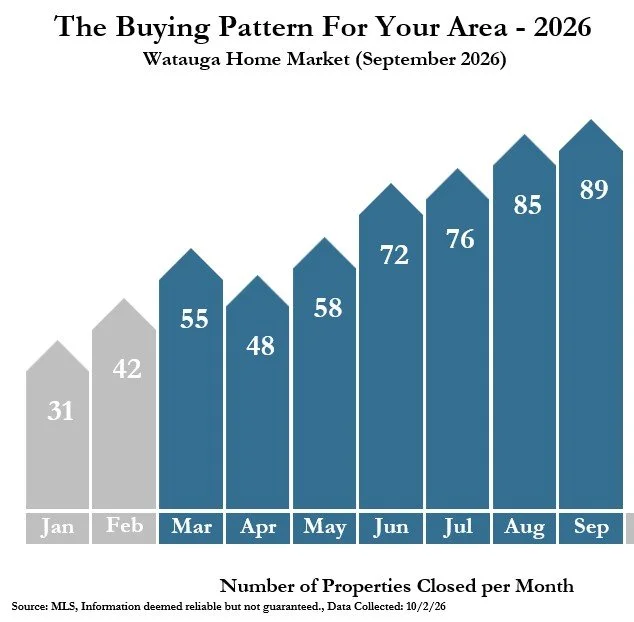
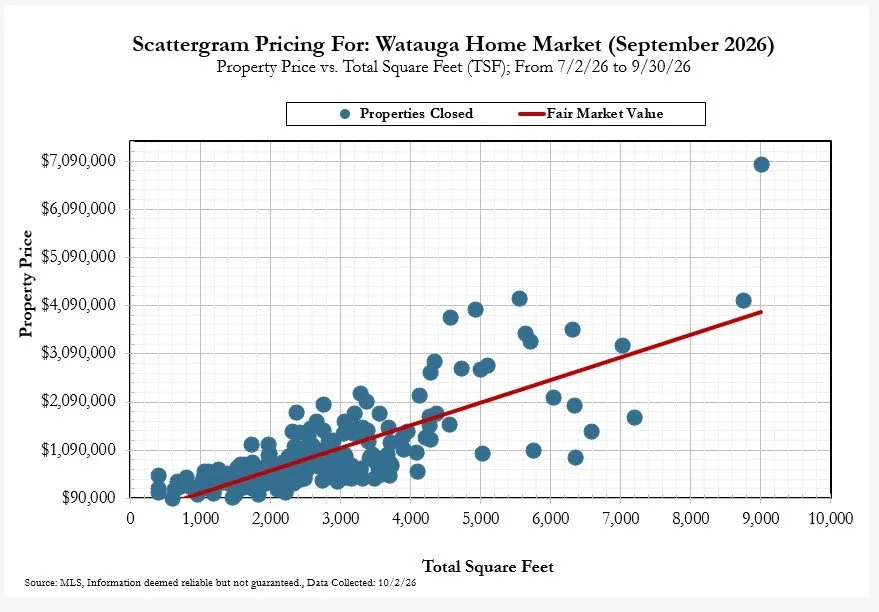
Below are the Buying Pattern graphs for 2025, followed by the current Buying Pattern graph - this allows you to compare what is happening this year to what happened last year.
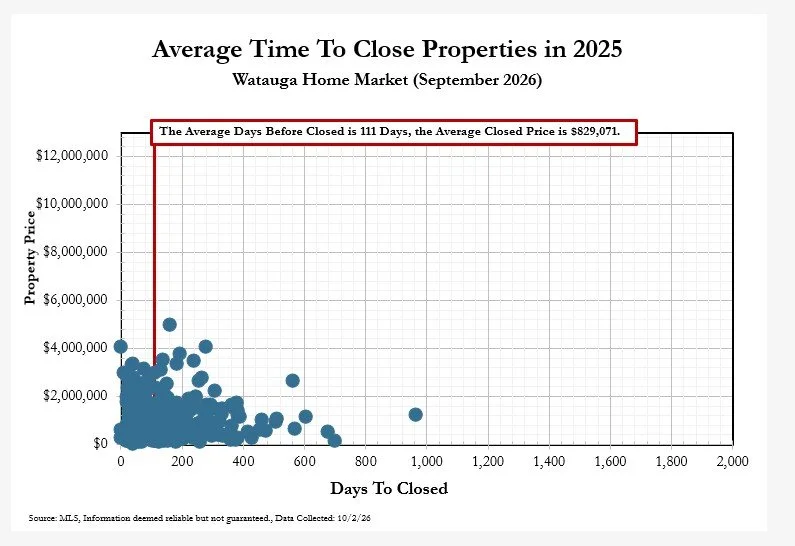
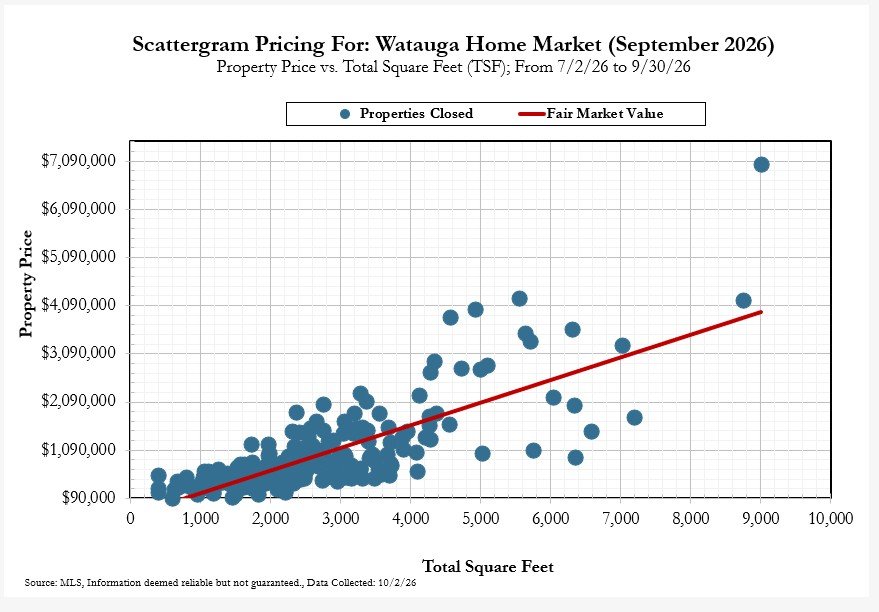
Below are the Time to Close graphs - first for 2025, followed by the current Time to Close graph. This allows you to compare how long it is taking to close properties compared to a year ago, and also compared the average closed home values a year ago to current closed home values.
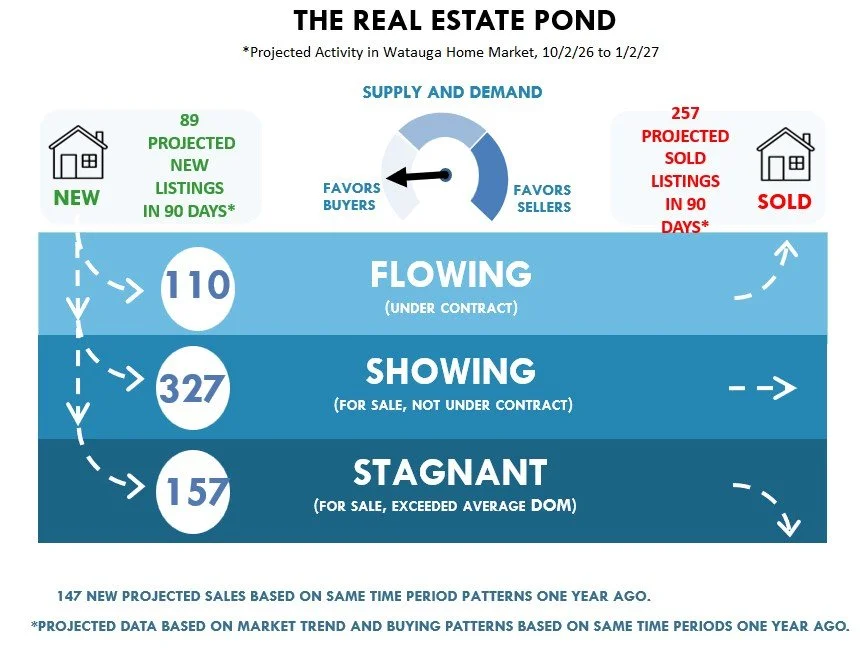
The Pond graph looks back at the rate properties sold a year ago and uses those buying patterns to project what may happen in the next 90 days of 2026.