

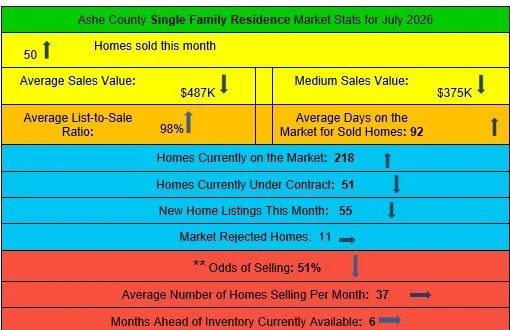
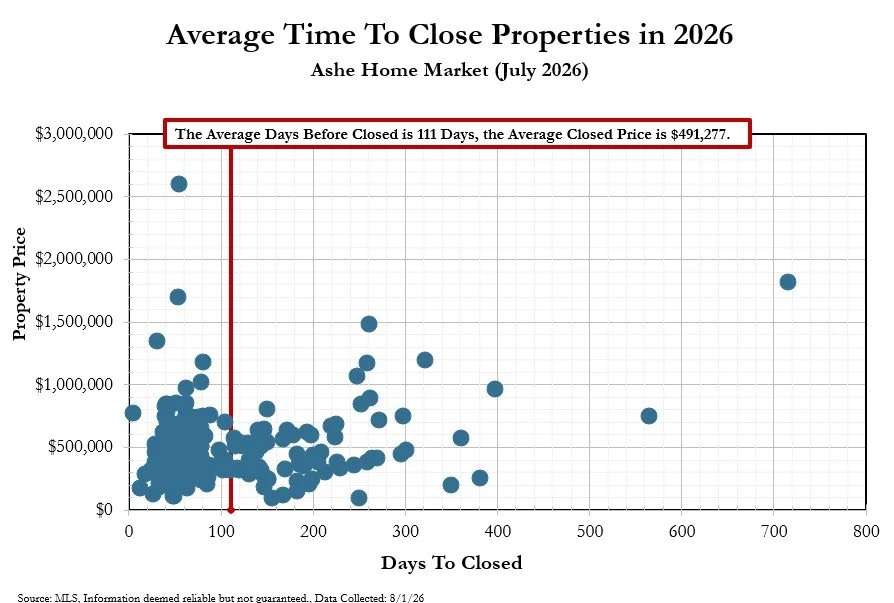
The Ashe Home market is a mixed bag. More homes sold in July [50 compared to 39 in June]. However, less are currently under contract than at the beginning of July [currently 51 are under contract. On July 1 71 were under contract]. The average and median sales values are lower. Homes are taking about 14 days longer, on the average, to close. The Odds of Selling slipped from 52% Odds to 51% Odds. The number selling per month is holding steady as is the months ahead of inventory.
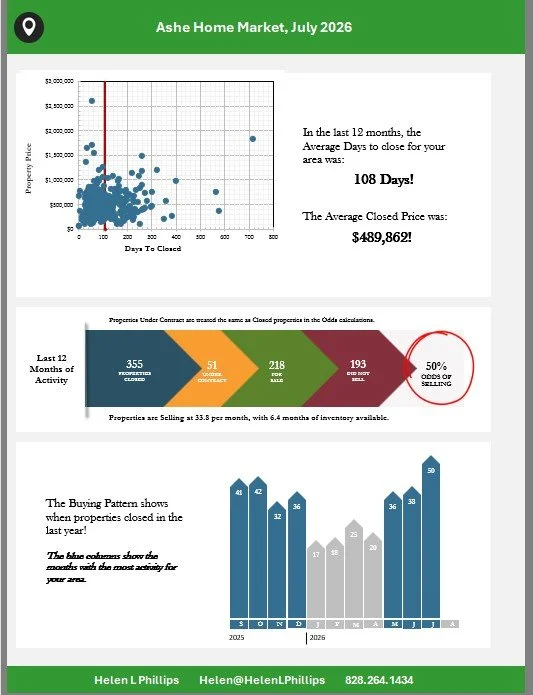

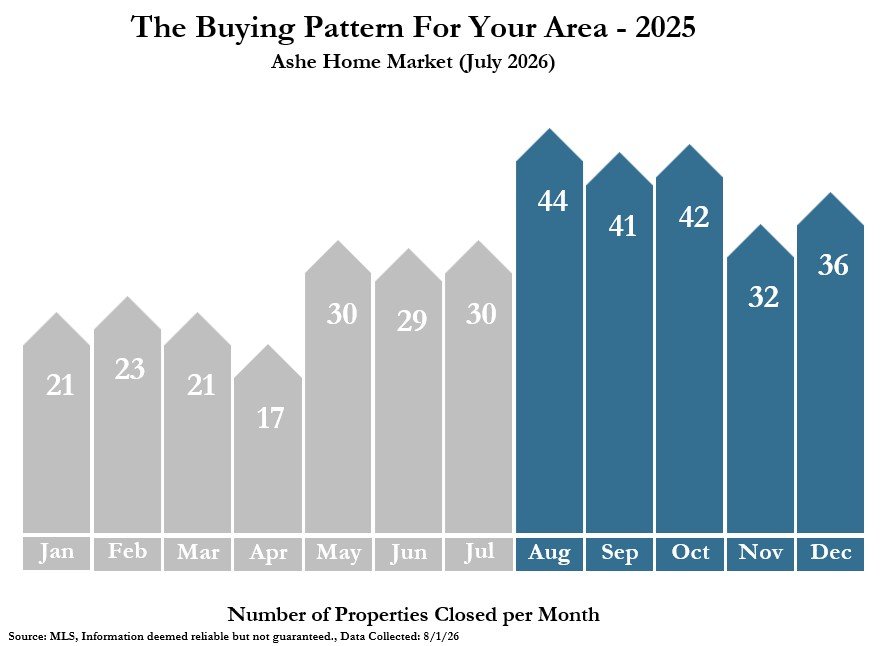
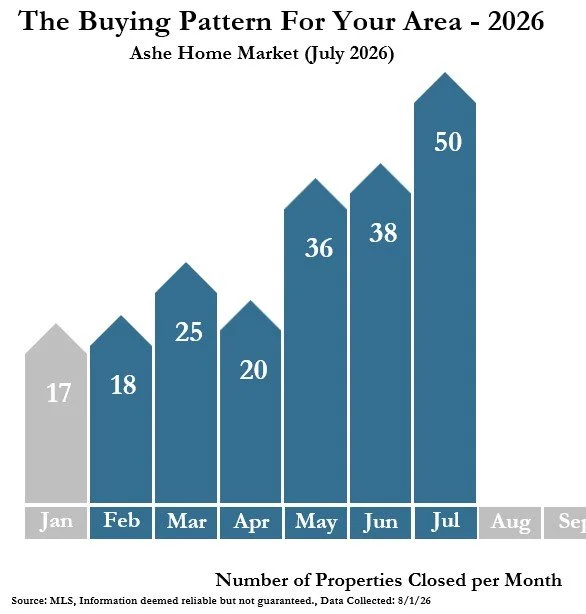
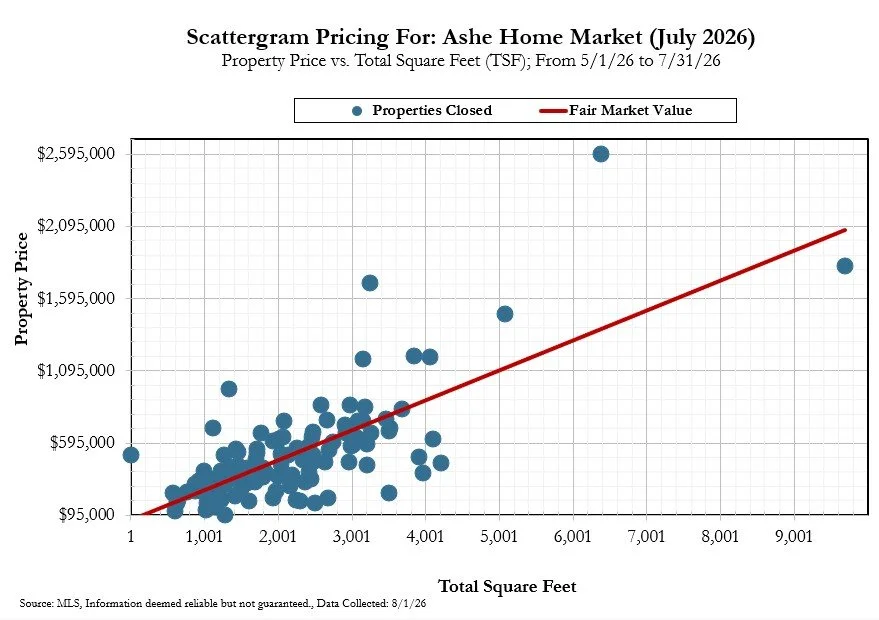
Below are the Buying Pattern graphs for 2025, followed by the current Buying Pattern graph - this allows you to compare what is happening this year to what happened last year.
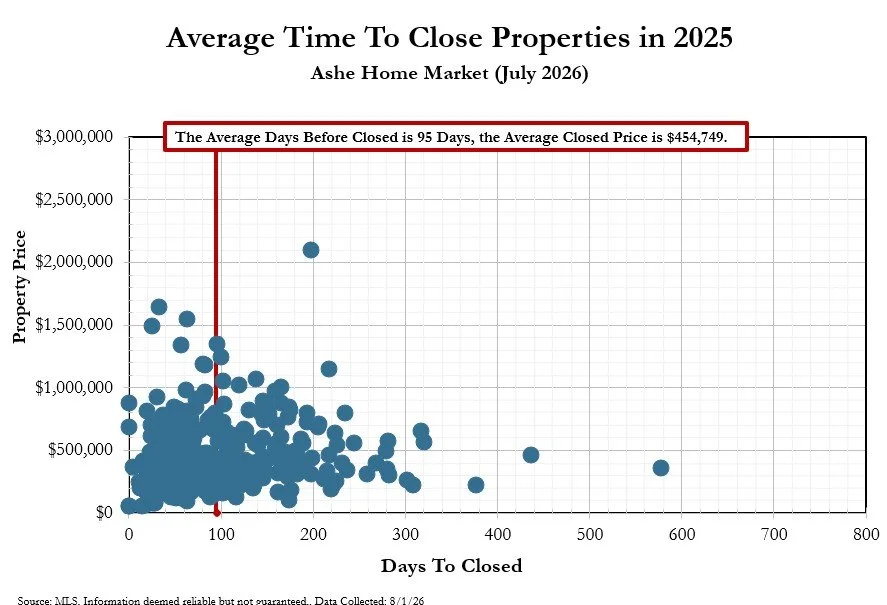
Below are the Time to Close graphs - first for 2025, followed by the current Time to Close graph. This allows you to compare how long it is taking to close properties compared to a year ago, and also compared the average closed home values a year ago to current closed home values.
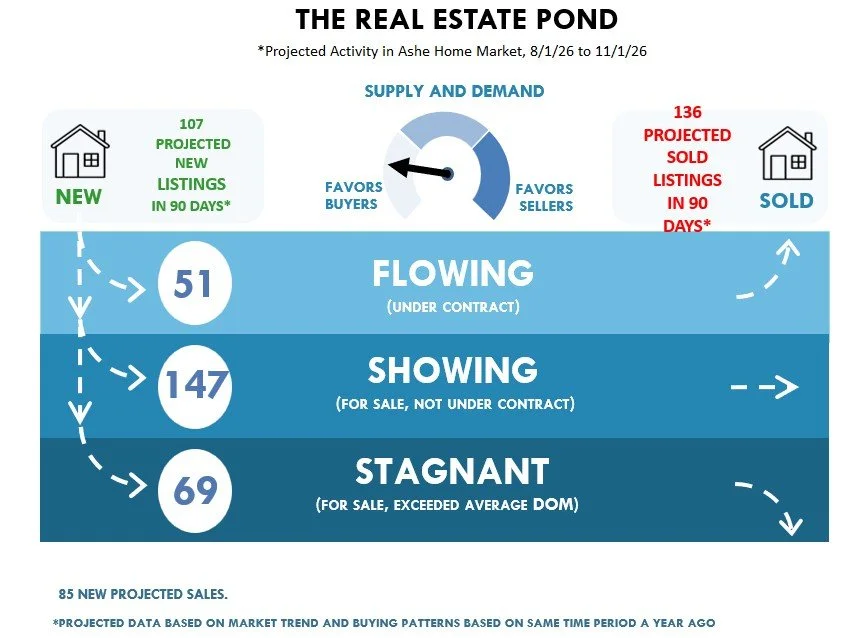
The Pond graph looks back at the rate properties sold a year ago and uses those buying patterns to project what may happen in the next 90 days of 2026.