

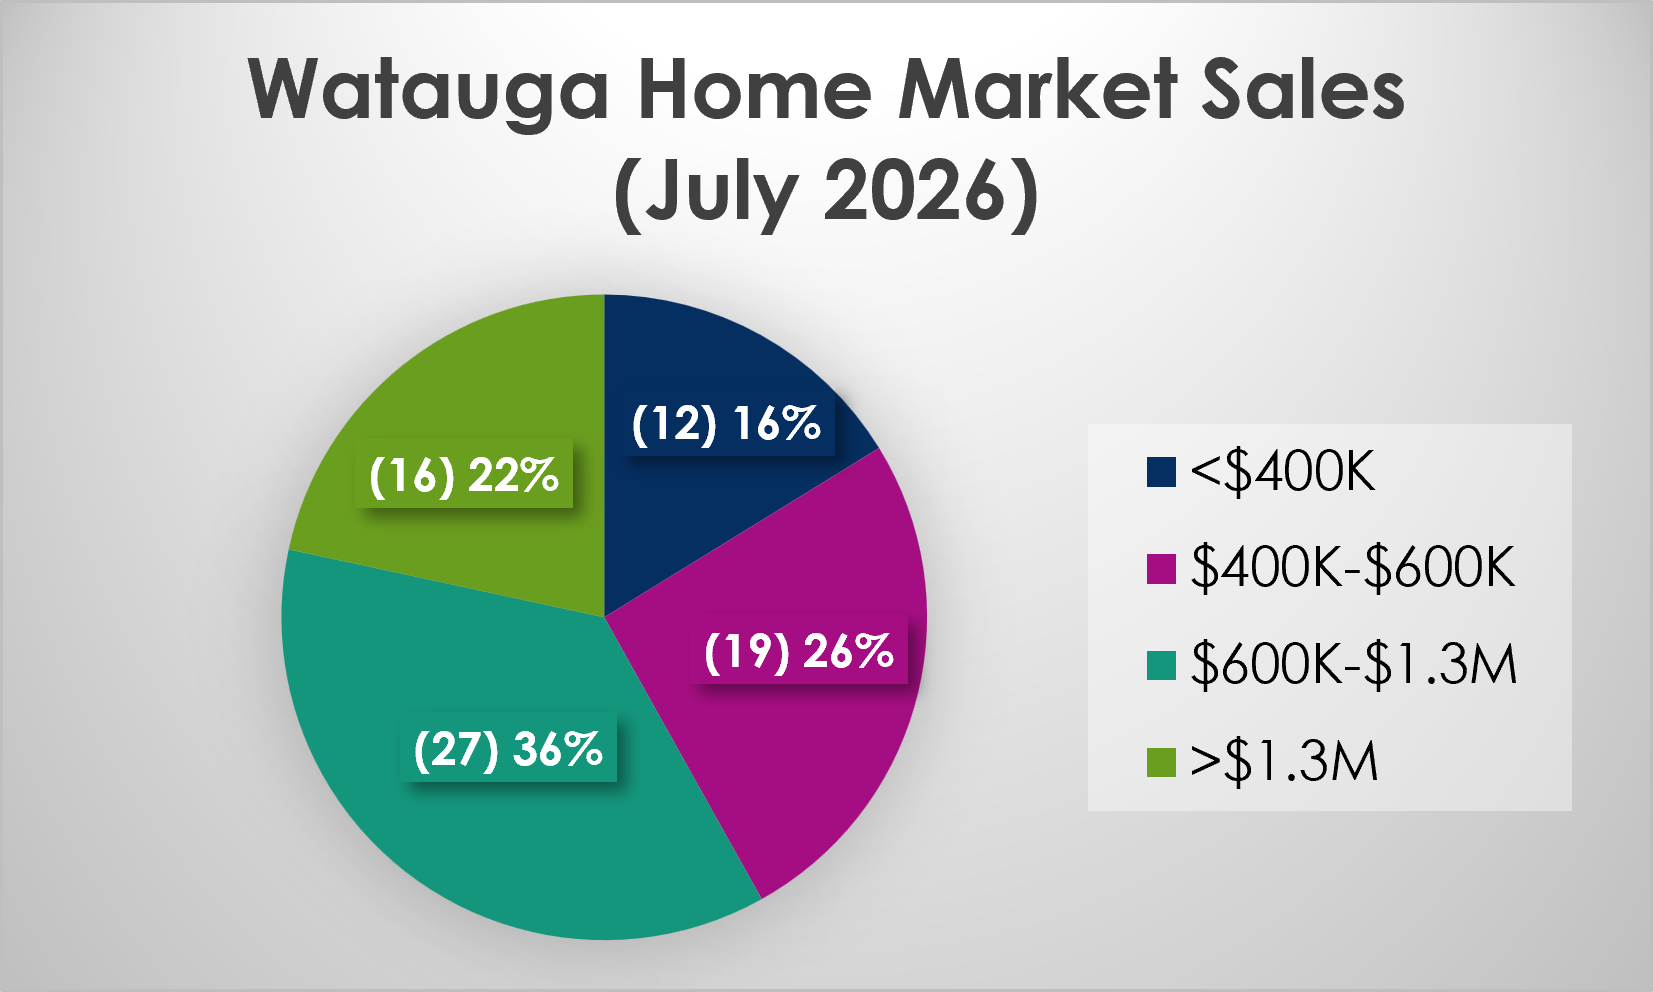
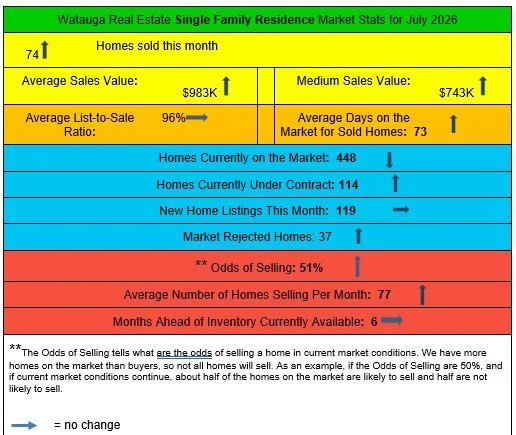
The Watauga Market is showing the increased activity we expect in July. A few more homes sold in July than June. The average and median sales values have increased. The list-to-sell ratio is the same as June, and days on the market is holding steady. There are less homes on the market, and that reflects the slightly improved Odds of Selling. 20% more homes are under contract than at the beginning of the month. Nevertheless, the Pond demonstrates it continues to be a buyers’ market.
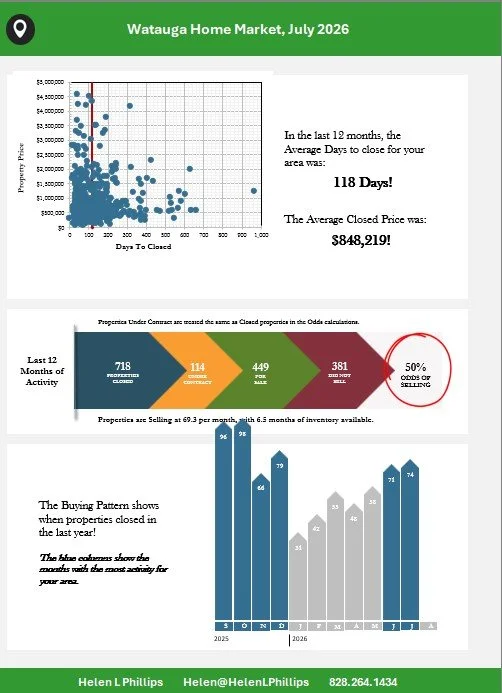

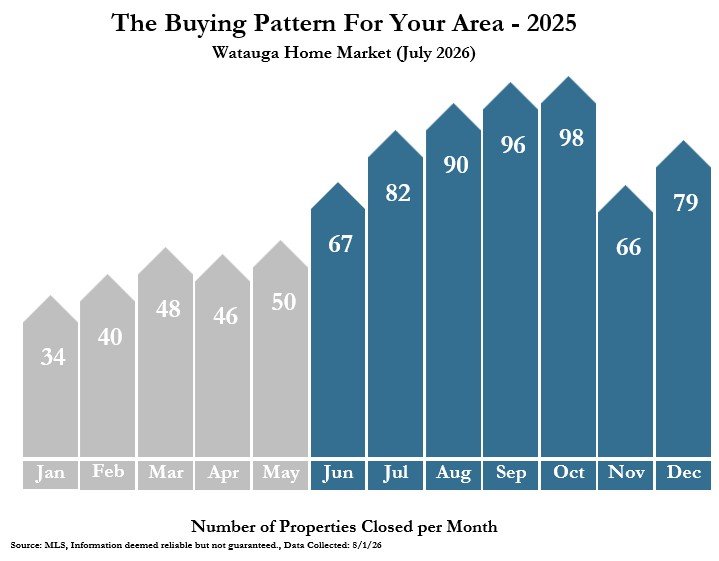
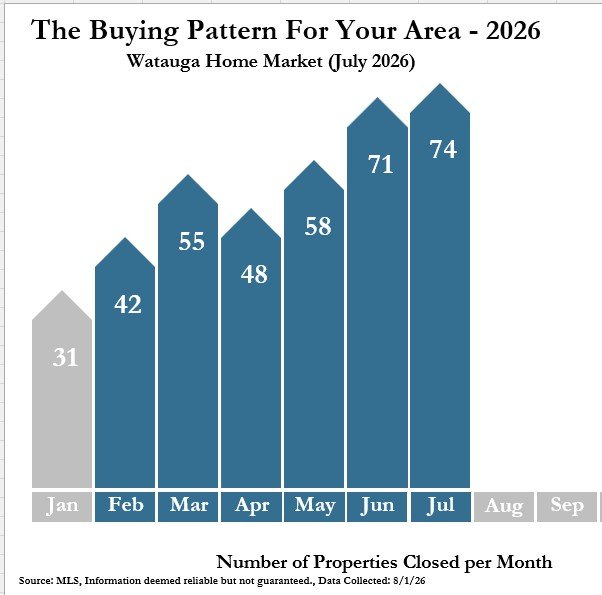
Below are the Buying Pattern graphs for 2025, followed by the current Buying Pattern graph - this allows you to compare what is happening this year to what happened last year.
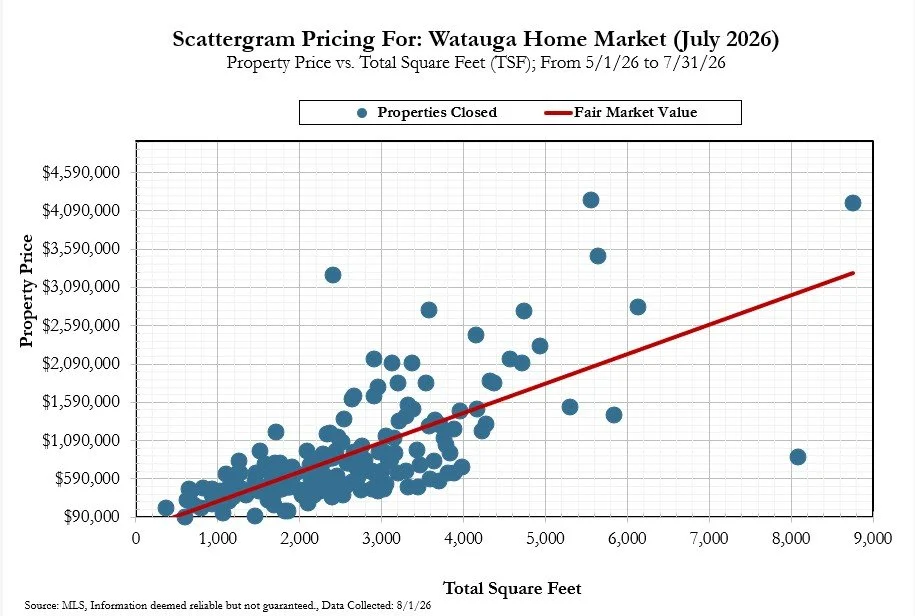
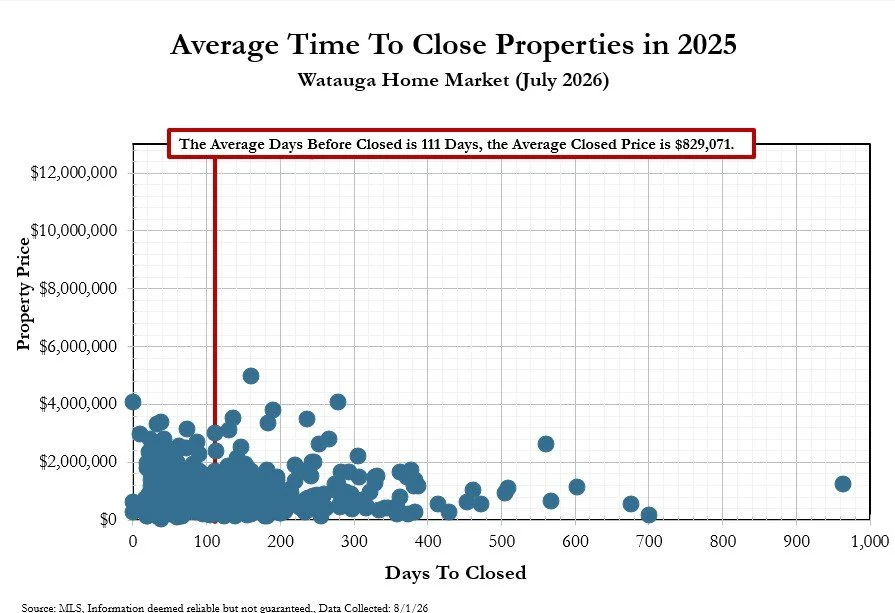
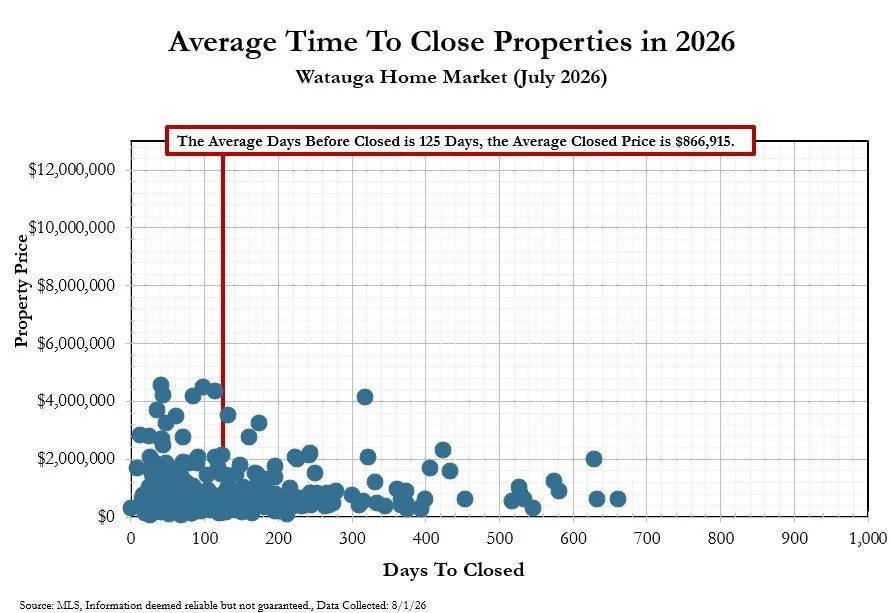
Below are the Time to Close graphs - first for 2025, followed by the current Time to Close graph. This allows you to compare how long it is taking to close properties compared to a year ago, and also compared the average closed home values a year ago to current closed home values.

The Pond graph looks back at the rate properties sold a year ago and uses those buying patterns to project what may happen in the next 90 days of 2026.