Watauga Home Market February 2026

Some patterns are evident this month. Other stats are rather ‘all over the place.’
The number of sales for both Ashe and Watauga homes, as well as for land, remain low. For the second month of 2026 buyer interest continues to look very similar to the sales pattern in 2025.
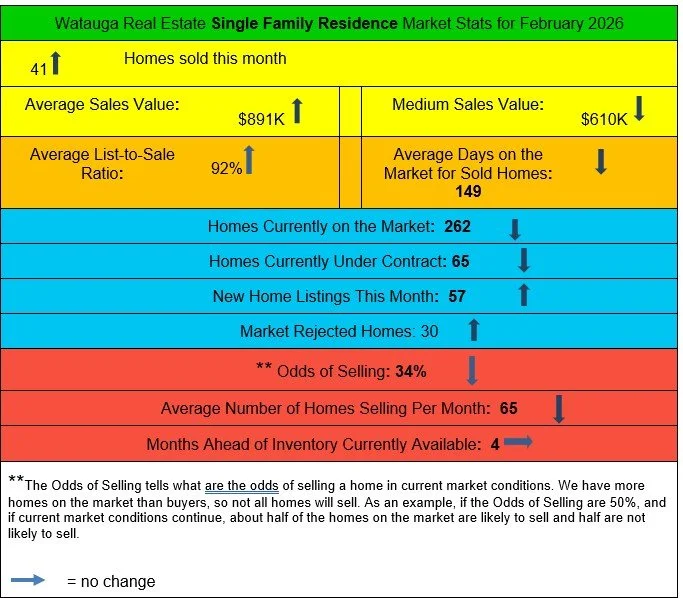
For the Watauga home market: the number of sold homes is up, the number of new listings is up, the list to sell ratio has increased, and the number of days on the market has decreased – these are signs of a warming market. On the other hand, the number under contract is down, the number selling per month is down, and the Odds of Selling has sharply decreased to 34% - these are signs of a cooling buyer market.
The market continues to show many price reductions in the home market. That is not surprising in a home market wherein few homes are selling. For the land market: occasionally the price is reduced, in line with the low number typically seen in the land market.
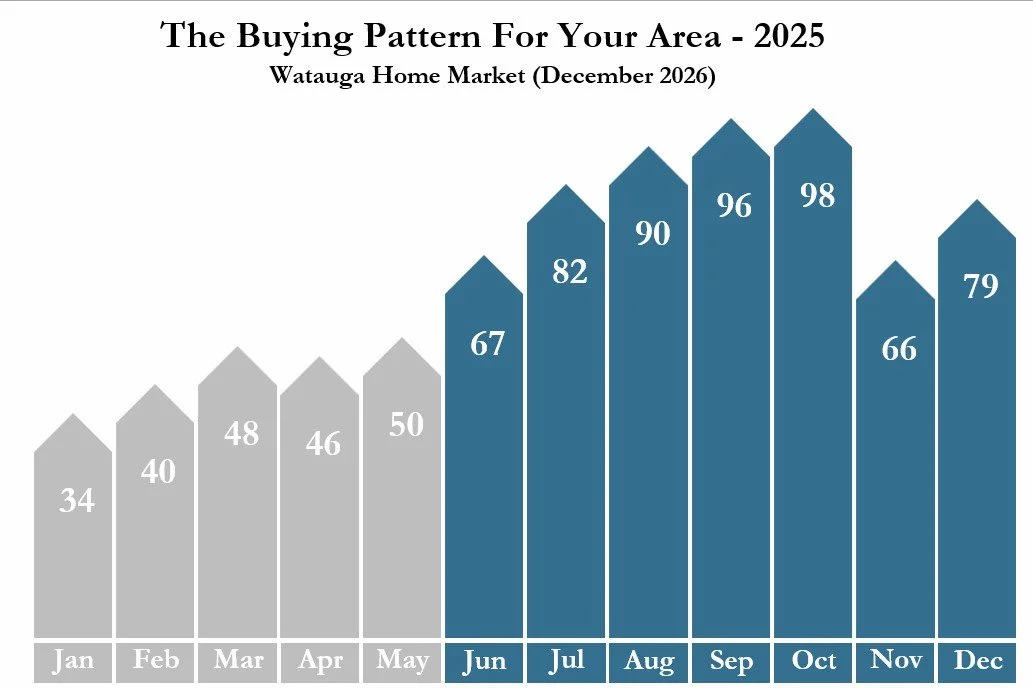
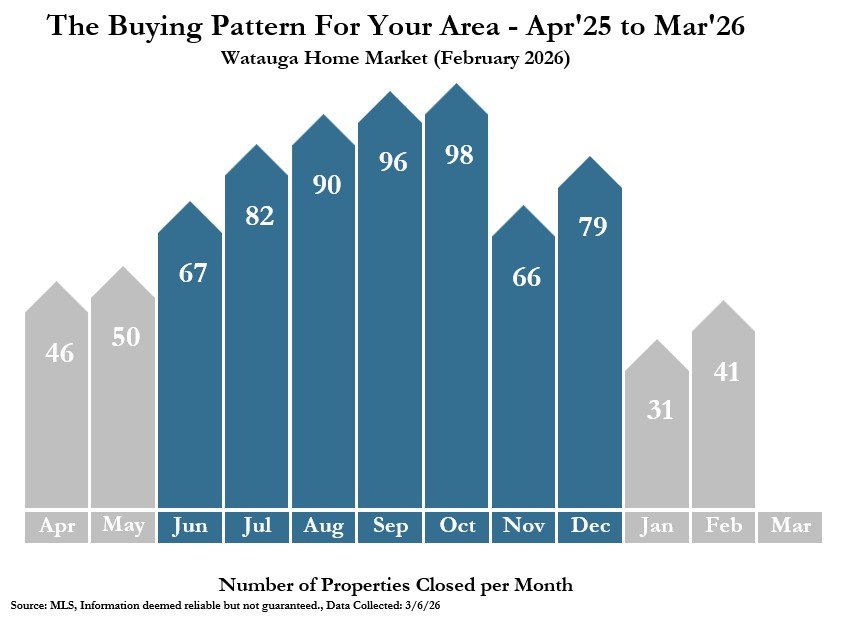
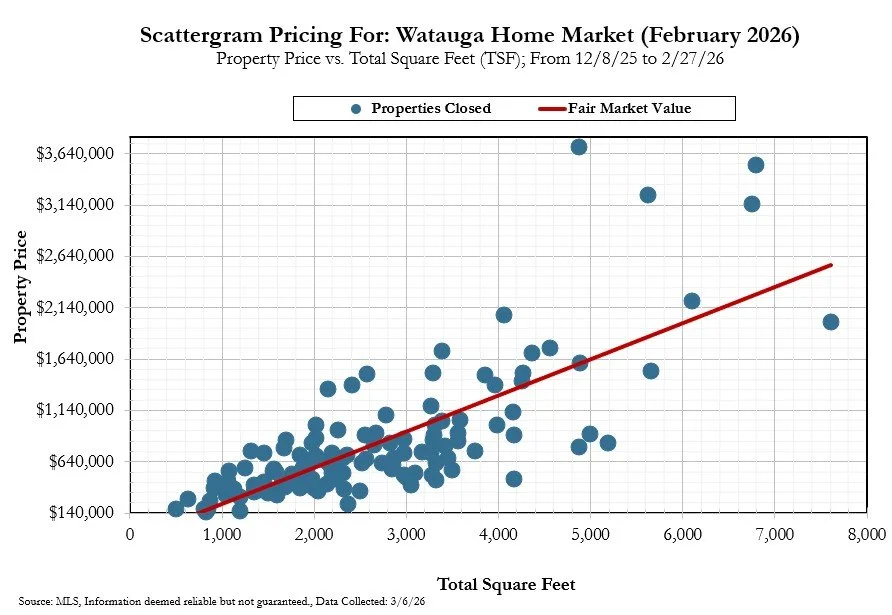
Below are the Buying Pattern graphs for 2025, followed by the current Buying Pattern graph - this allows you to compare what is happening this year to what happened last year.
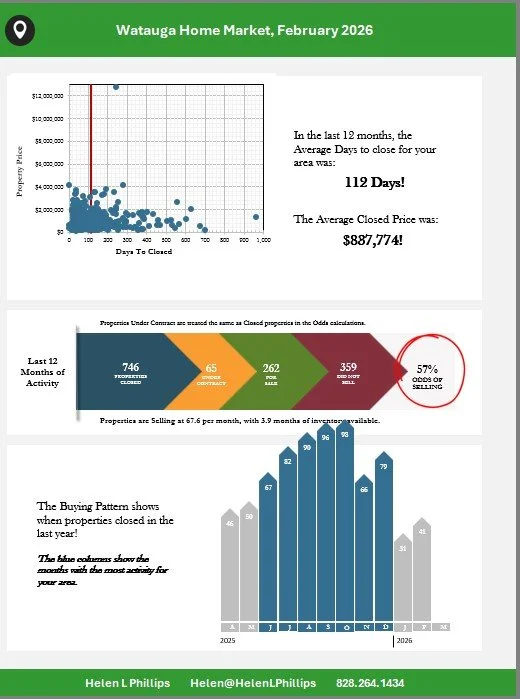
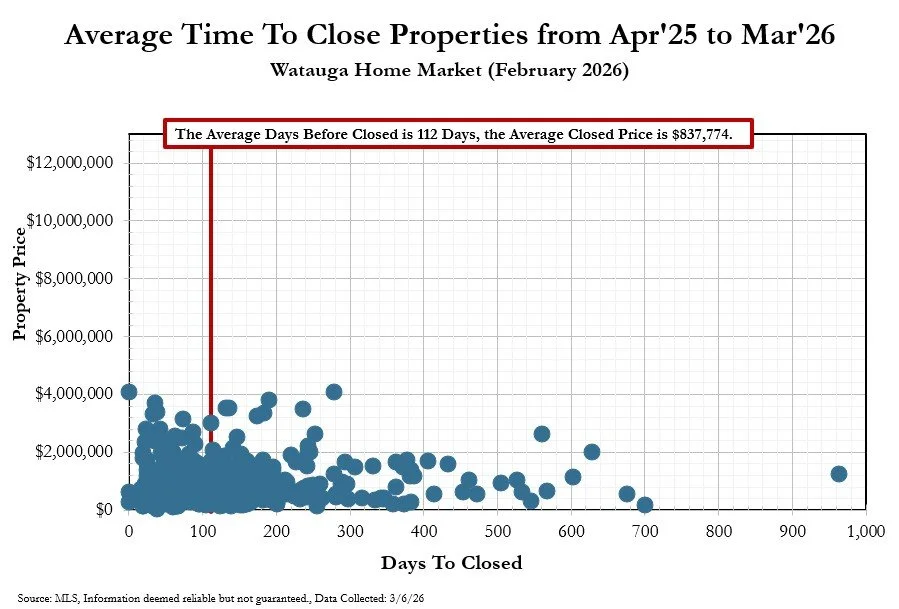
Below are the Time to Close graphs - first for 2025, followed by the current Time to Close graph. This allows you to compare how long it is taking to close properties compared to a year ago, and also compared the average closed home values a year ago to current closed home values.

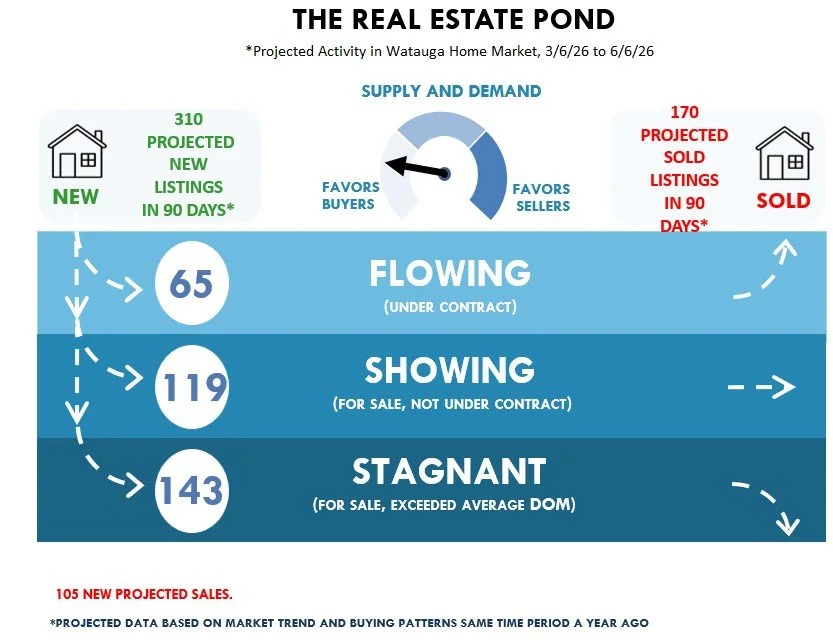
The Pond graph looks back at the rate properties sold a year ago and uses those buying patterns to project what may happen in the next 90 days of 2026.