
What is the Significance of Odds of Selling?
An important aspect of my job is to help people, particularly sellers, understand market conditions — especially how current market conditions affect the sale of their home.
Market conditions include:
How many competing properties are on the market
How frequently homes & land are selling (an indication of how many buyers are seriously interested in purchasing)
Sales values of homes & land
All of this boils down to the current Odds of Selling.
Perhaps looking at two different markets will help to understand the Big Picture of the market. Below is a comparison of the Watauga Home Market and High Country Land Market today versus 10 years ago.
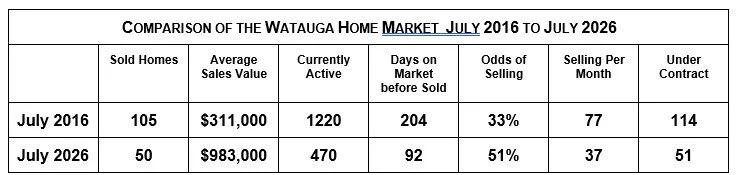
One amazing difference immediately stands out: Average Sales Value, from $311,000 in 2016 to $983,000 in 2026. Perhaps you find it difficult to absorb as ‘normal’ an average sales value just short of $1 million. That number, in a small part, is due to the many homes currently selling well above $1 million. In July 2016, 5 homes sold over $1 million, in a range of $1.1 million to $1.4 million. In July 2026, 42 homes sold in a range of $1 million to $4.1 million.
This is why it is important for sellers to understand Odds of Selling. Odds of Selling is a calculation based on: number of homes & land currently active on the market, the number under contract, and the number that were market rejected (left the market unsold). Another way to frame the Odds of Selling is, “How likely am I to sell my property?” or, “How is the market flowing?” The Odds of Selling in 2026 show a buyers’ market with 51% Odds of Selling — a seller is very slightly more likely to sell the property than not sell it, yet much more likely to sell than a seller in the 2016 market. That’s because three times as many homes were on the 2016 market, despite that many more were selling per month.
How should a seller be thinking about this? First, accept the current market for what it is. Their property of necessity will sell or not sell given current market conditions. There’s nothing a single person can do to change current market conditions. Second, think about your reason for selling. The reason is compelling in your life. Then, evaluate which is better for your life — in a timeframe for what is going on in your life now, imagine your life continuing to own the property versus what will your life be like when you sell. These are very individual considerations.
If, given your individual considerations, selling quickly is better for your life, then let’s talk about your options. My goal is to help you find the best resolution for selling your property.
An excellent way to understand Odds of Selling is to look at Buying Patterns graphs. They help visualize ‘seasonality,’ i.e. what times of the year most buyers are actively purchasing properties.
The following graphs visually depict the typical buying pattern for mountain properties – a rise from slower sales in the winter months to higher sales in the summer months. They also depict how different one year can be compared to another, with a much lower number of sales in 2026 compared to 2016.
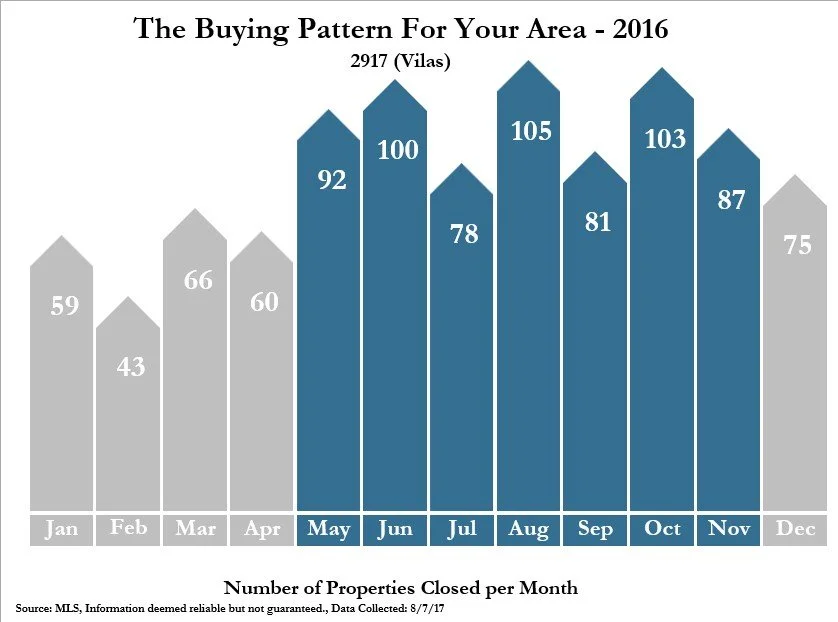
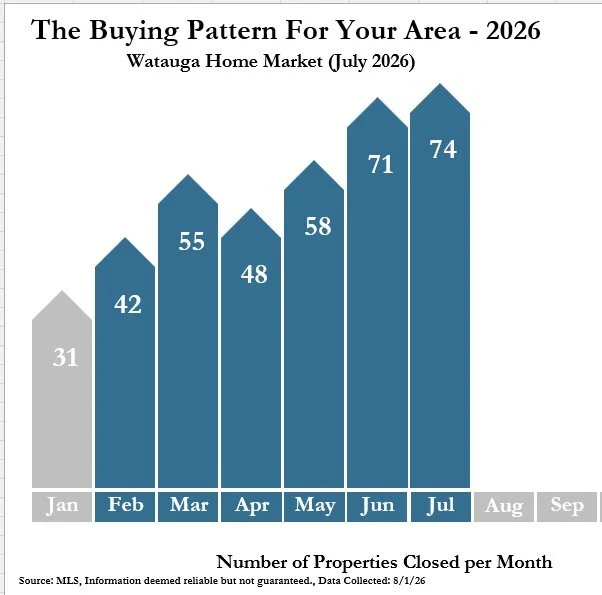
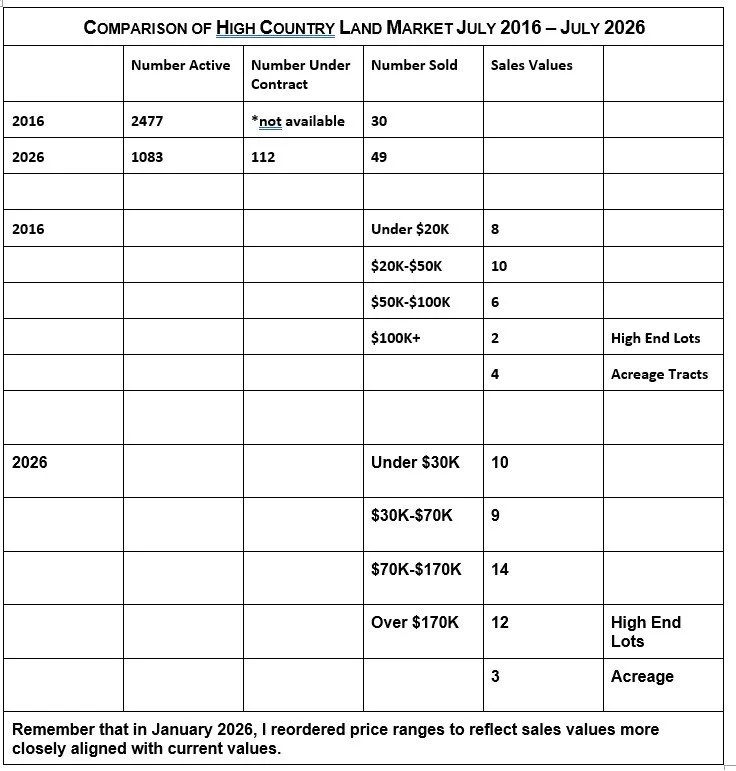
The most striking difference between 2016 and 2017 is the number of properties on the market. Remember, from the crash in 2008 until the early 2020’s, the number of properties on the market (originally around 3000 properties in 2009) very slowly decreased each year; there were very few buyers until around 2020 when sales increased enough to lower the number of active properties on the market to around 1000. For sellers, that has greatly increased the Odds of Selling, although the ~1000 properties per month figure is holding steady month to month with number sold; number under contract; number market rejected.
Stay safe. Stay well. As always, I truly hope you will allow me the opportunity to address all your questions and concerns.